|
|
|
|
|
|
|
CCROP – Model Concepts*CCROP – Model Concepts*
*See CCROP User Manual for detail on input parameters needed, processes and functions simulated, and output generated.
- What is a plant growth model?
A plant growth model is a computer program which uses mathematical equations to describe how plants grow. Fortunately, models which simulate crop growth and development have been successfully developed for many of the world’s important crops. However, very little effort has been made to model ornamental crop production in containers – until now.
- What is CCROP?
The plant growth model we have developed for simulating production of ornamental plants in small containers is called CCROP which is an acronym for
Container Crop Resource Optimization Program.
Reference:
Million, J.B., Ritchie, J.T., Yeager, T.H., Larsen, CA, Warner, CD, and J.P. Albano. 2011. CCROP – Simulation model for container-grown nursery plant production. Scientia Horticulturae 130(4):874-886.
- How does CCROP approach simulating plant growth?
The foundation of CCROP
is the simulation of leaf area growth and development. The
rate of leaf area development, i.e. leaf appearance, is controlled
primarily by temperature. The leaf canopy controls the amount of
light intercepted for photosynthesis thereby controlling the
amount of energy available for additional leaf area growth and
biomass accumulation. Leaf area also influences evapotranspiration
(ET) rates with soil evaporation rates decreasing and plant
transpiration rates increasing as the leaf canopy approaches
capturing 100% of incoming solar radiation. Through its affect on ET,
photosynthesis, and plant growth, simulation of leaf area growth
therefore provides a means for determining plant water and nutrient
demands. If daily water and nutrient demands of the plant exceed
daily water and nutrient supplies in the substrate, plant growth is
reduced through negative feedback.
- What assumptions are made for CCROP?
- All plants are the same. We know that this is not true but simulations are based upon an average, idealized plant.
- Except for water-holding properties, substrates are assumed to behave identically with regards to chemical and physical properties.
- There are no pest or disease problems affecting growth.
- Irrigation water is applied uniformly and the amount applied is what would be caught at the top level of the plant canopy
- Controlled-release fertilizers (CRF) are assumed to have similar release patterns. In other words, differences in N release from CRFs under a given set of growing conditions are due to differences in the longevity rating of the CRFs.
- Transplants are uniform and of good quality.
- Plants are assumed to have been watered thoroughly at planting so that the substrate is at container capacity at the start.
- Substrate is fertilized at planting.
- Plants are grown on industry-standard, black, woven, polypropylene groundcloth.
- Container spacing is uniform throughout the production period.
- What language is CCROP written in? Can I view the code?
CCROP was developed and written in FORTRAN computer language. Please contact Jeff Million or Tom Yeager for obtaining access to the FORTRAN code.
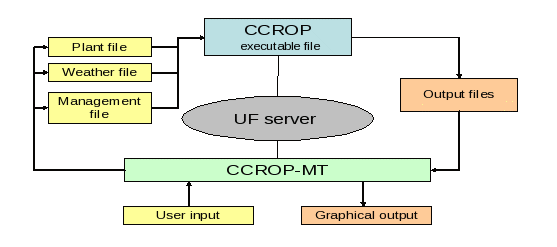
- What are Container Crop Management Tools?
Container Crop Tools provide a user-friendly means for changing plant, weather and management input files, running CCROP, and viewing the output (see figure below).
- What tools are available?
(1) GROWER TOOL: This tool is streamlined for evaluating practices which have a major impact on profitability and resource conservation. The GROWER TOOL runs a simulation based on one set of input conditions. The output is more detailed and includes daily time-plots as well as summary plots and tables.
(2) COMPARISON TOOLS: This set of tools allows the user to run 'what-if' experiments to evaluate several levels of a given production practice. Simulations are run to compare two or more levels of a given factor or practice. For example, the user can evaluate the effect of four different fertilizer rates or the effect of three different irrigation schedules. For these comparisons, all other production practices selected by the user are held constant. The output includes comparison summary plots and tables (no daily time-plots).
(3) TECHNICAL TOOL: This tool allows the user to change any input parameter in the CCROP model.
(4) REAL-TIME IRRIGATION TOOL: This irrigation scheduling tool provides the user with a daily recommended amount of irrigation water to apply based upon simulated day-to-day progress of a crop.
- Does it work with all plant species?
CCROP is based on research with two plant species:
(1) Viburnum odoratissimum (sweet viburnum) is a fast-growing woody ornamental with large leaves and an upright-spreading growth habit
(2) Ilex vomitoria (dwarf yaupon holly) is a slow-growing woody ornamental with small leaves and a broad-spreading growth habit.
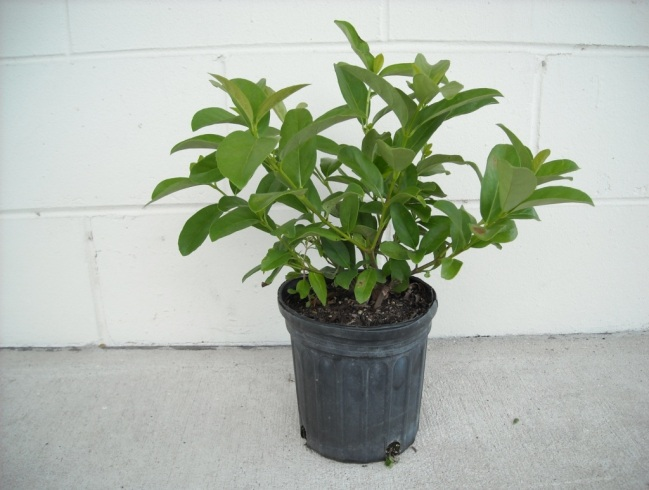
Viburnum odoratissimum (sweet viburnum) |
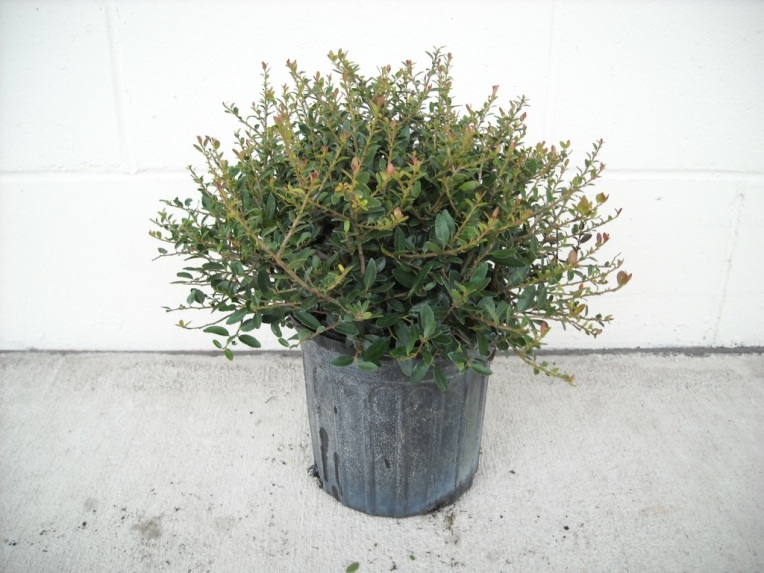
Ilex vomitoria (dwarf yaupon holly) |
- Does CCROP work with all container sizes?
CCROP simulates production in trade #1 or trade #3 containers watered with overhead, sprinkler irrigation.
- What are the default inputs?
Default values are included for all management inputs. These values are not necessarily recommended but are provided as a means for running the program with minimal input changes. The user can change one or more of the default settings and run the simulation. While all input management variables in CCROP are accessible in the TECHNICAL TOOL, many management input variables are not accessible or are offered with limited options in the GROWER TOOL, COMPARISON TOOLS, and REAL-TIME IRRIGATION SCHEDULING TOOL.
Input variables that can not be modified or have limited options include:
- Maximum number of container moves is limited to one for trade #1 containers and two for trade #3 containers.
- Liner transplant has a leaf area of 150 cm2, height of 14 cm, width 12 cm, N concentration of 0.8% in shoots and 0.6% in roots.
- Container size options limited to:
- Trade #1 (2400 cm3 of substrate and top diameter of 16 cm)
- Trade #3 (10000 cm3 of substrate and top diameter of 28 cm)
- Substrate available water-holding capacity is assumed to be 25% by volume (50% drained upper limit and 25% lower limit). This is equivalent to 600 cm3 per trade #1 container (1.2 inches) or 2500 cm3 (4.1 inch) per trade #3.
- When model-recommended irrigation rate is selected, the managed allowable deficit (MAD) is 10% (percent of available water that is lost before irrigation is triggered).
- Nitrogen and phosphorus concentration of irrigation water is 0 mg/L (ppm).
- No supplemental fertilizer applications can be made.
- Automatic pruning is assumed (pruning will be delayed if growing conditions are less than optimal):
- Trade #1 pruned once: 8 weeks after planting (WAP)
- Trade #3 pruned three times: 8 WAP, 14 WAP, and 20 WAP
Note: Use the TECHNICAL TOOL to have full control of all input variables.
- What is the difference between output on a container-basis versus an area-basis?
CCROP simulates plant growth as well as water and nutrient dynamics during production. This means there are a lot of output variables to consider! Units must also be considered. In this regard, CCROP outputs are expressed on either a container basis (often useful for resource efficiency evaluations) or an area basis (often useful for environmental evaluations). Conclusions drawn may be different using the two types of output because container density (number of containers per area) can change if containers are moved during the season.
The TECHNICAL TOOL uses metric units for all input and output variables while a combination of English and metric units are used in GROWER TOOL, COMPARISON TOOLS, and REAL-TIME IRRIGATION SCHEDULING TOOL.
|
|
|
|